Green Dot
- Bullish on 6h and above
- Neutral on lower timeframes
- Coincides with EMA ribbon uptrends
Two complementary tools to read trend and momentum faster. Chart Killer A shows bias and high-conviction continuations; Chart Killer B delivers early, leading entries with multi-oscillator confirmation. Read. React. Repeat.
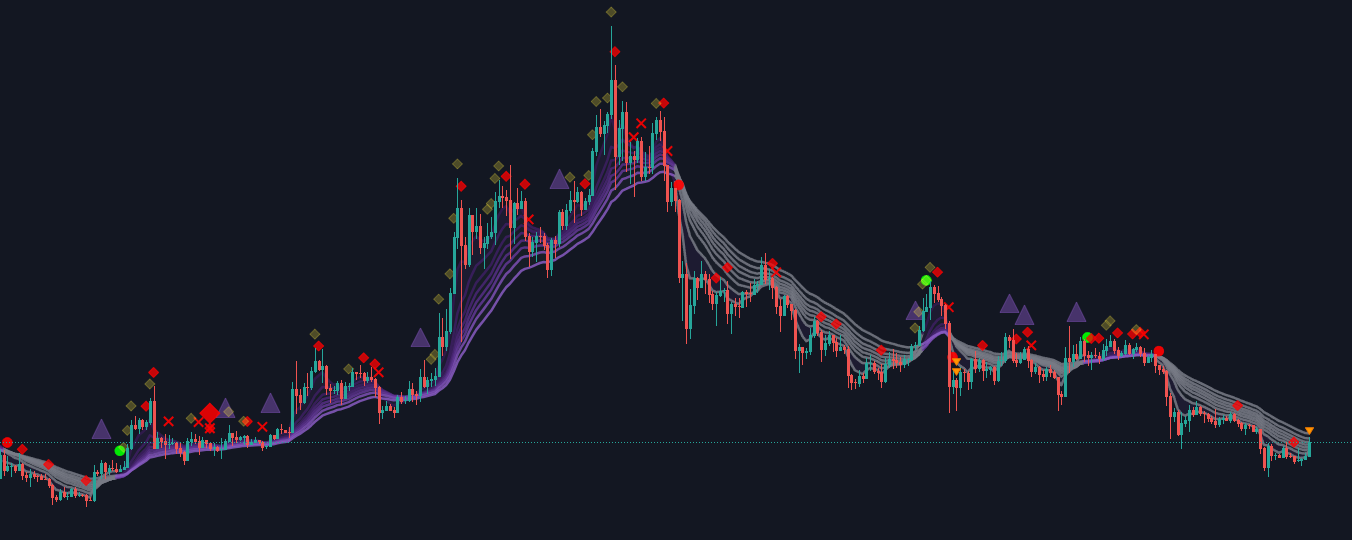
Chart Killer A is an EMA ribbon of 8 EMAs that turns purple in uptrends and gray in downtrends. Intersections can be strong lagging indications, so we project symbols that map to those conditions — you don’t need to manually interpret countless crossings.
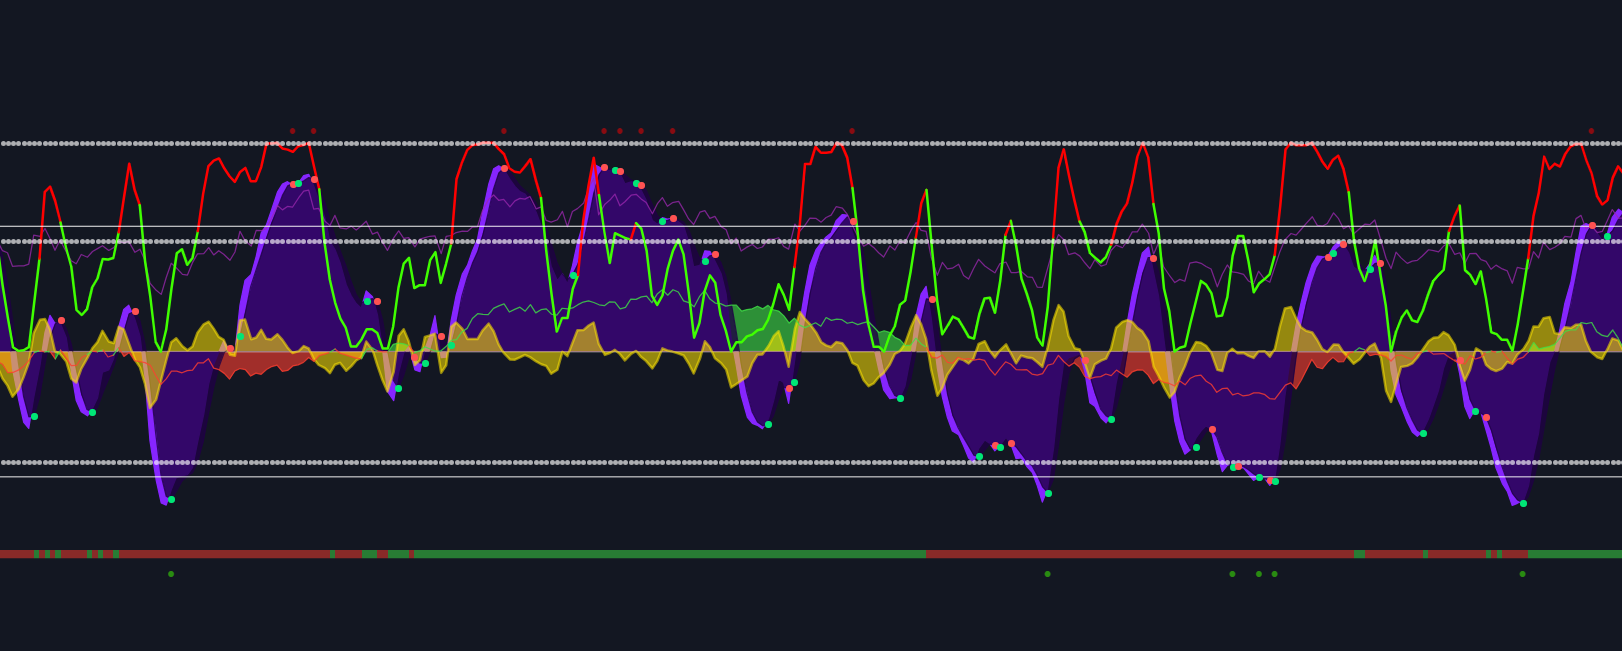
Chart Killer B combines five well-known algorithms: VWAP, MFI, RSI, Stoch, and Wave Trend. It’s built to surface clean, leading entries with simple confirmations you can act on.
Leading buy signals that excel in sideways and upward trends.
Leading sell signals that excel in sideways and downward trends.
Read overbought/oversold. To unlock the most edge, learn to spot divergent price action — it often foreshadows future moves.
VWAP is built into an oscillator. It’s the easiest read on B: cross up → long until the next cross down; cross down → short until the next cross up.
A clear visual of market conditions. When it’s green, “the grass is growing” — the Bulls are grazing and the strategy is to buy the dips. When it’s red, buyers are dead — look to short the peaks. You can filter many bad trades by paying attention to MFI.
RSI alone misses opportunities, but in tandem with the other oscillators in B, it adds an extra layer of confidence via overbought/oversold context.
One subscription includes both Chart Killer A & B.
Chart Killer A & B are educational tools and visualizations for TradingView. Nothing provided by Flip That Lot constitutes financial, investment, tax, or legal advice, a recommendation, or a solicitation to buy or sell any asset. You are solely responsible for your trading decisions and results.
By purchasing or using our products, you agree to our Terms of Service and Privacy Policy.